
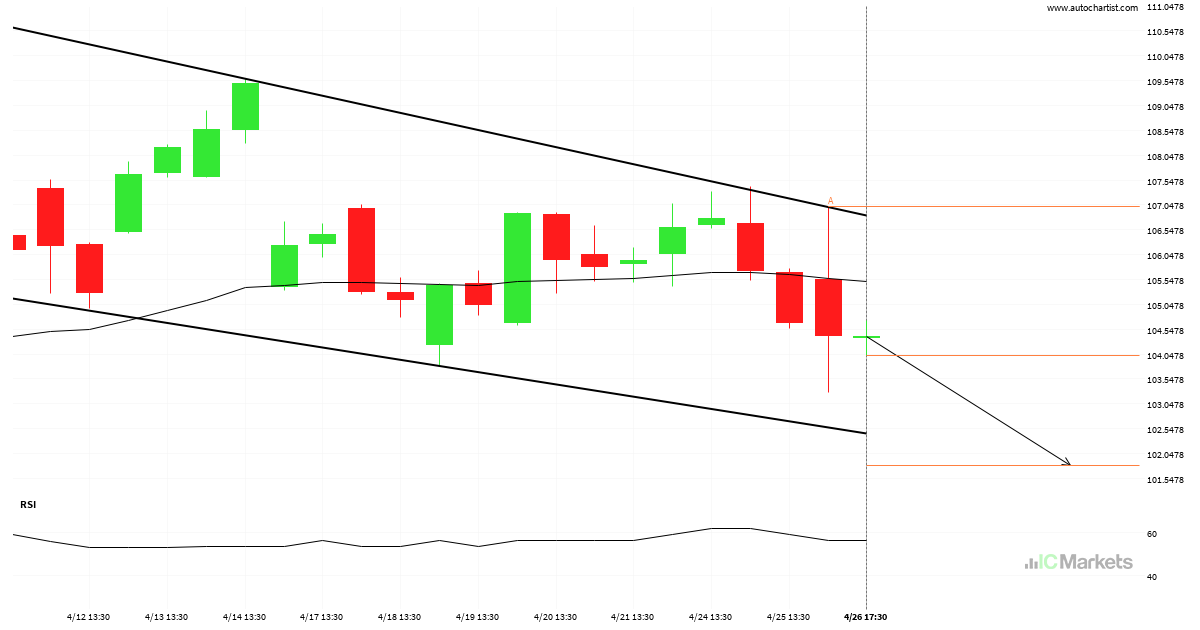
ALPHABET INC CLASS C approaching support of a Cunha descendente
ALPHABET INC CLASS C is approaching the support line of a Cunha descendente. It has touched this line numerous times in the last 21 days. If it tests this line again, it should do so in the next 2 days.
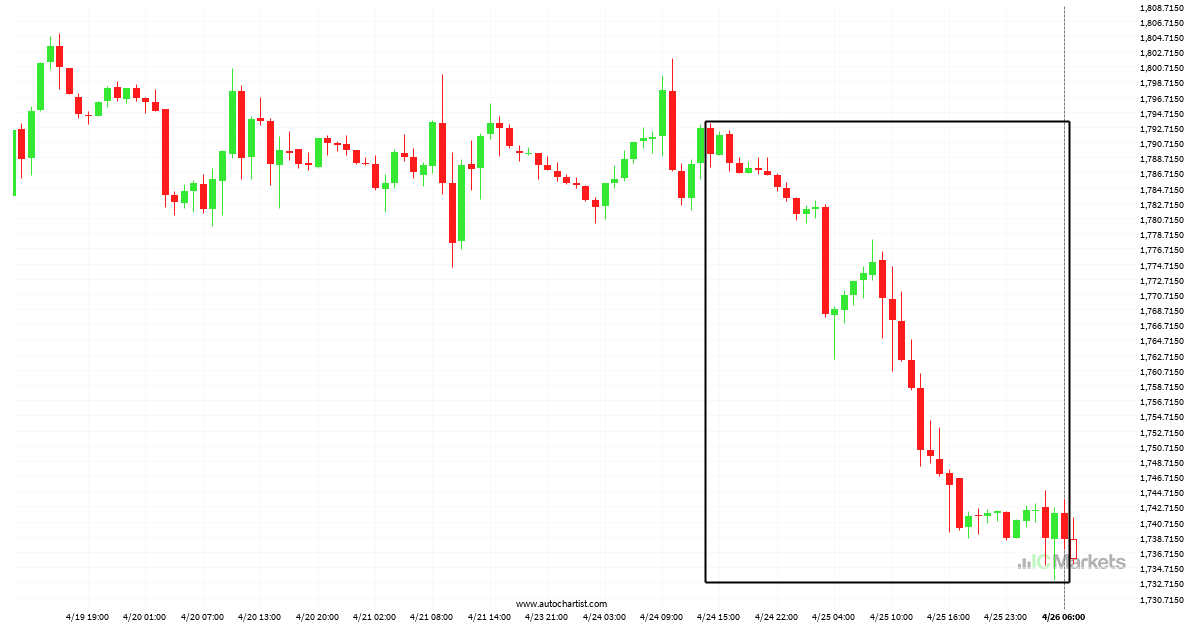
Huge bearish move on US Small Cap 2000 Index
US Small Cap 2000 Index has moved lower by 2,83% from 1789.13 to 1738.41 in the last 2 days.
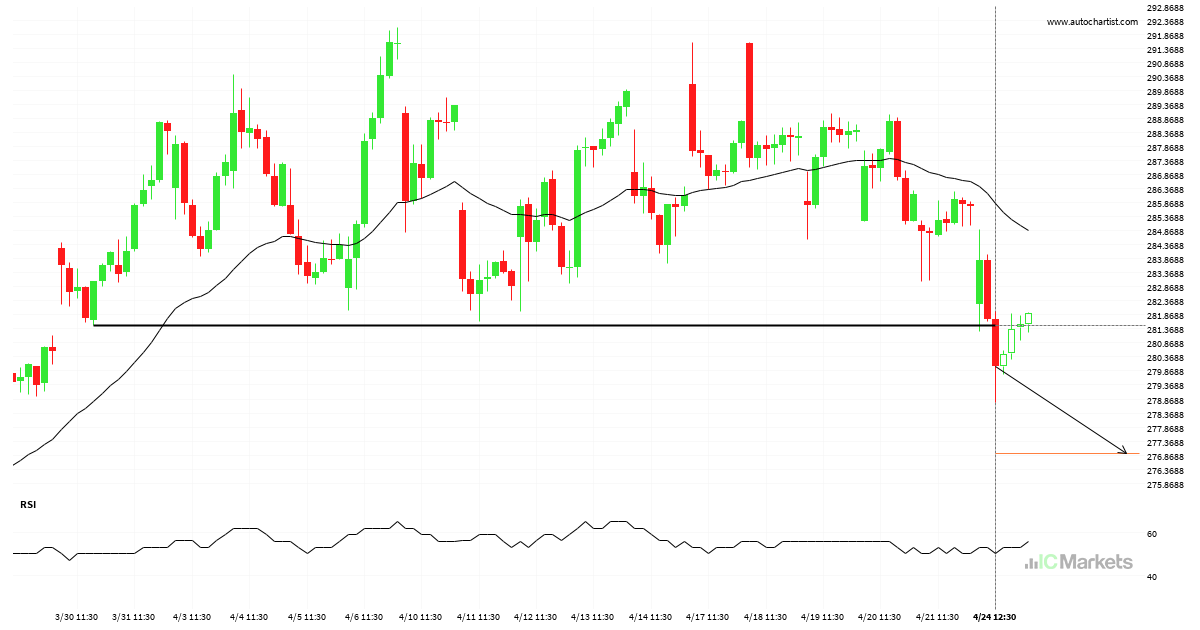
Microsoft Corporation broke through important 281.5000 price line
Microsoft Corporation has broken through a support line. It has touched this line numerous times in the last 25 days. This breakout shows a potential move to 276.9380 within the next 23 hours. Because we have seen it retrace from this level in the past, one should wait for confirmation of the breakout.
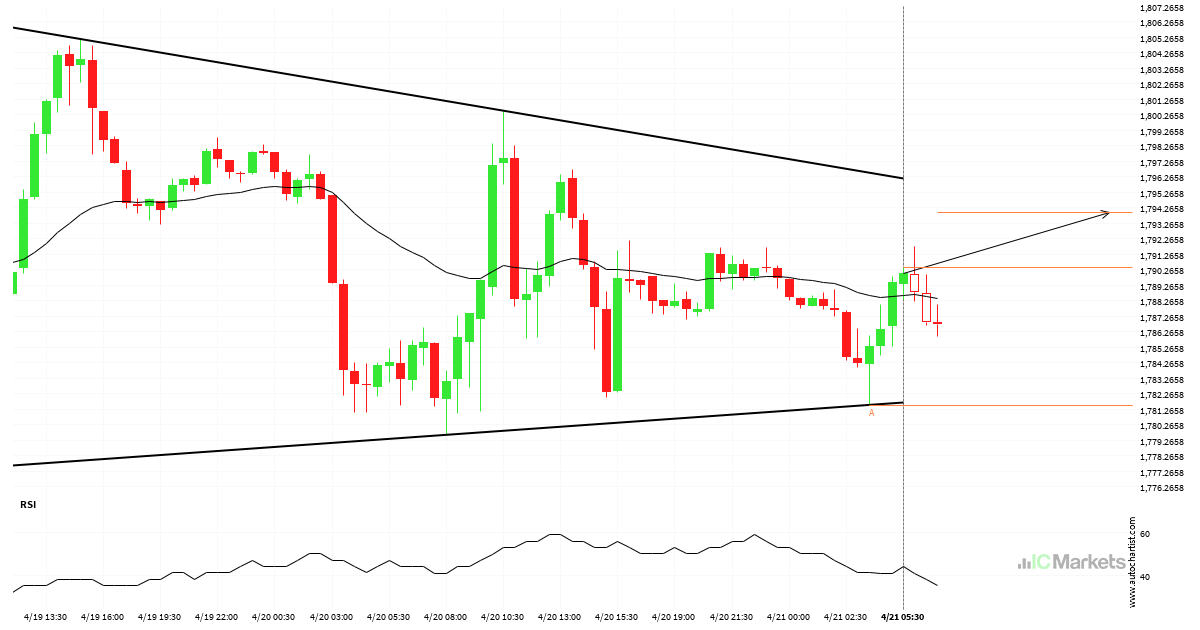
US Small Cap 2000 Index approaching resistance of a Triângulo
US Small Cap 2000 Index is approaching the resistance line of a Triângulo. It has touched this line numerous times in the last 2 days. If it tests this line again, it should do so in the next 10 hours.
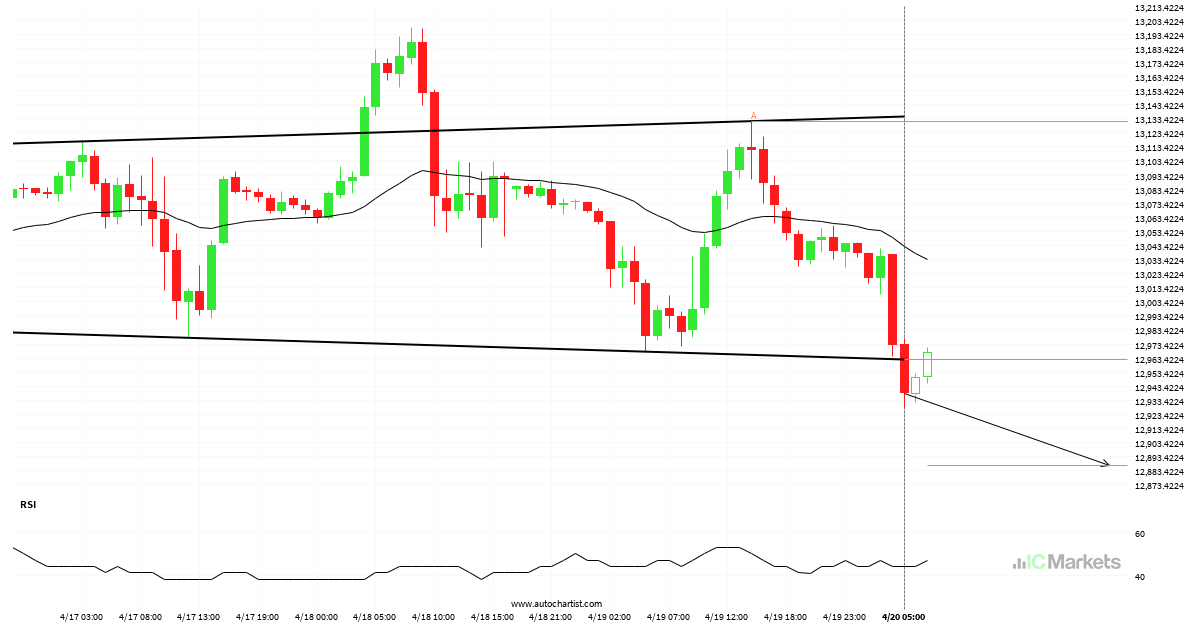
US Tech 100 Index has broken through support
US Tech 100 Index has broken through a support line. It has touched this line at least twice in the last 6 days. This breakout may indicate a potential move to 12887.4530 within the next 20 hours. Because we have seen it retrace from this position in the past, one should wait for confirmation of […]
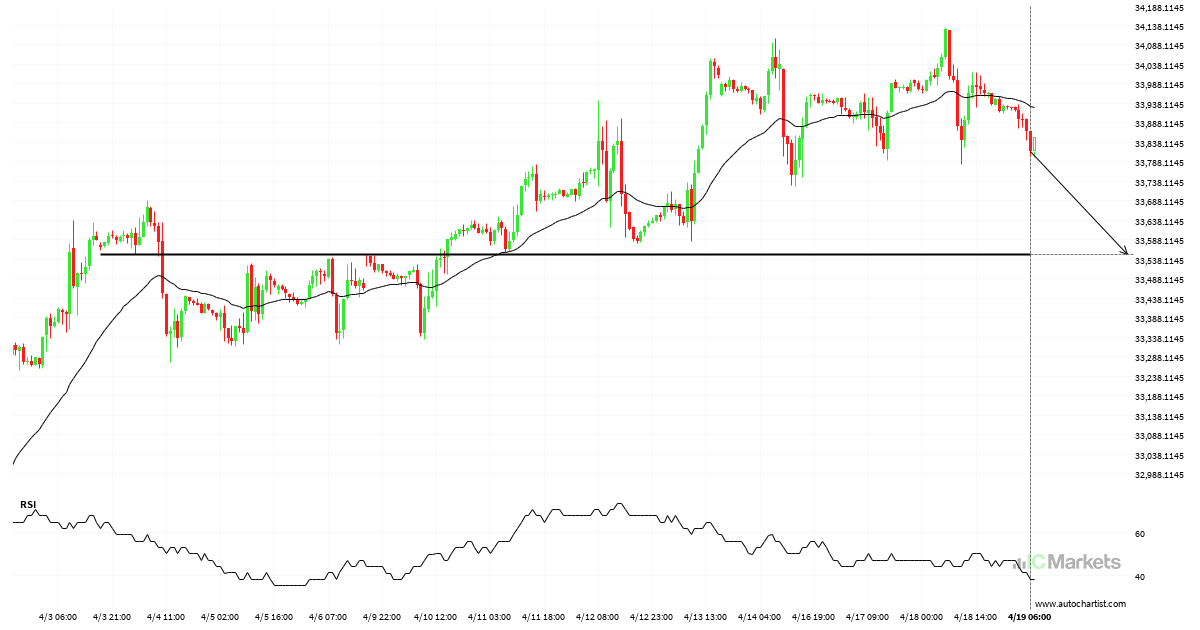
US Wall Street 30 Index – getting close to psychological price line
US Wall Street 30 Index is moving towards a support line. Because we have seen it retrace from this level in the past, we could see either a break through this line, or a rebound back to current levels. It has touched this line numerous times in the last 16 days and may test it […]
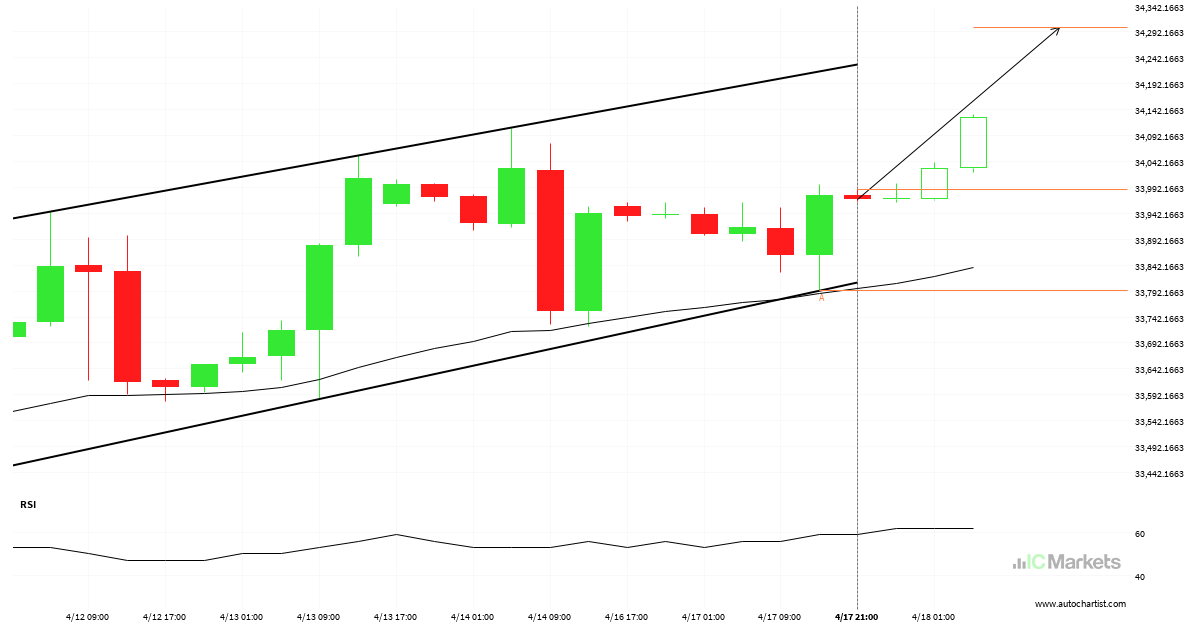
US Wall Street 30 Index approaching resistance of a Canal ascendente
US Wall Street 30 Index is approaching the resistance line of a Canal ascendente. It has touched this line numerous times in the last 8 days. If it tests this line again, it should do so in the next 14 hours.
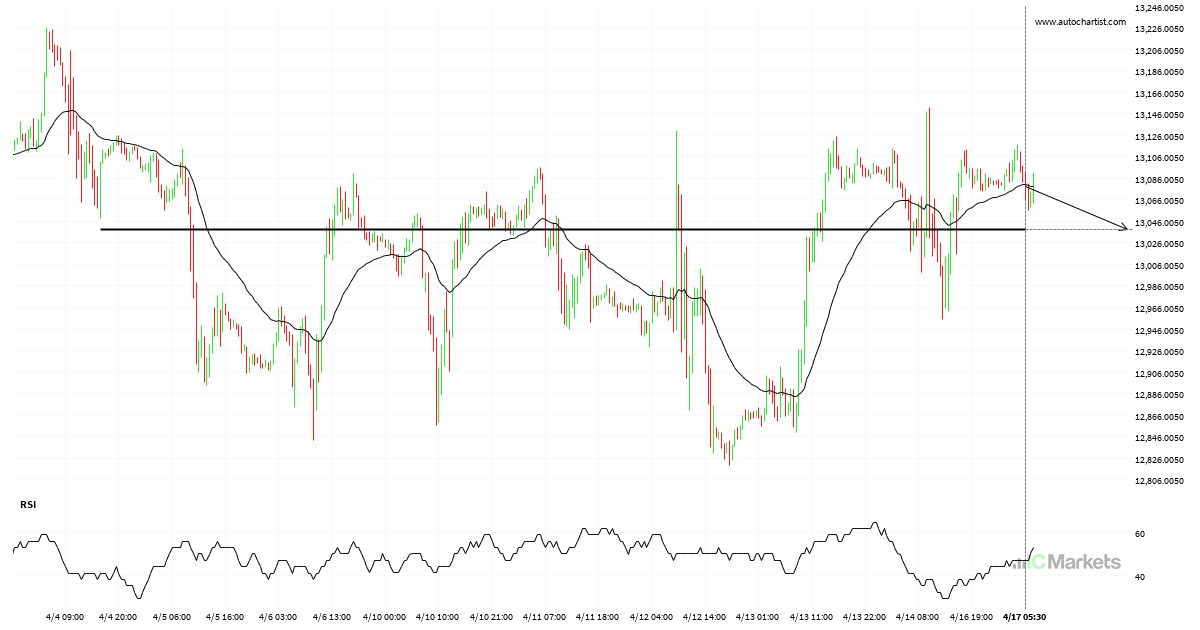
US Tech 100 Index – getting close to psychological price line
US Tech 100 Index is moving towards a support line. Because we have seen it retrace from this level in the past, we could see either a break through this line, or a rebound back to current levels. It has touched this line numerous times in the last 13 days and may test it again […]
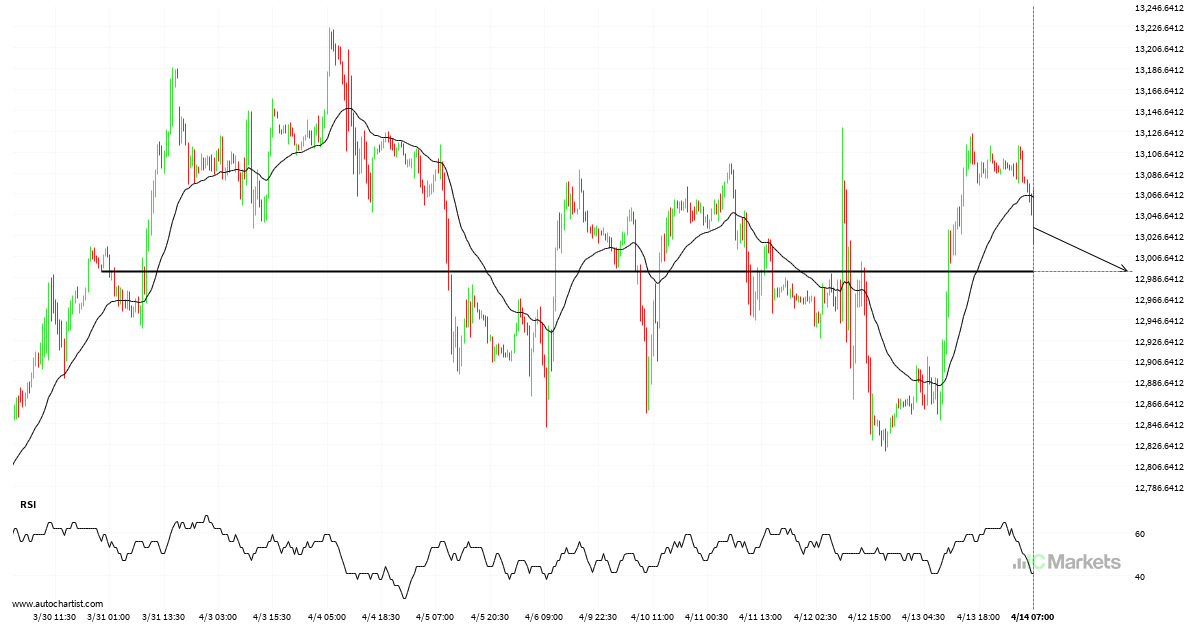
US Tech 100 Index – getting close to psychological price line
US Tech 100 Index is moving towards a support line. Because we have seen it retrace from this level in the past, we could see either a break through this line, or a rebound back to current levels. It has touched this line numerous times in the last 15 days and may test it again […]
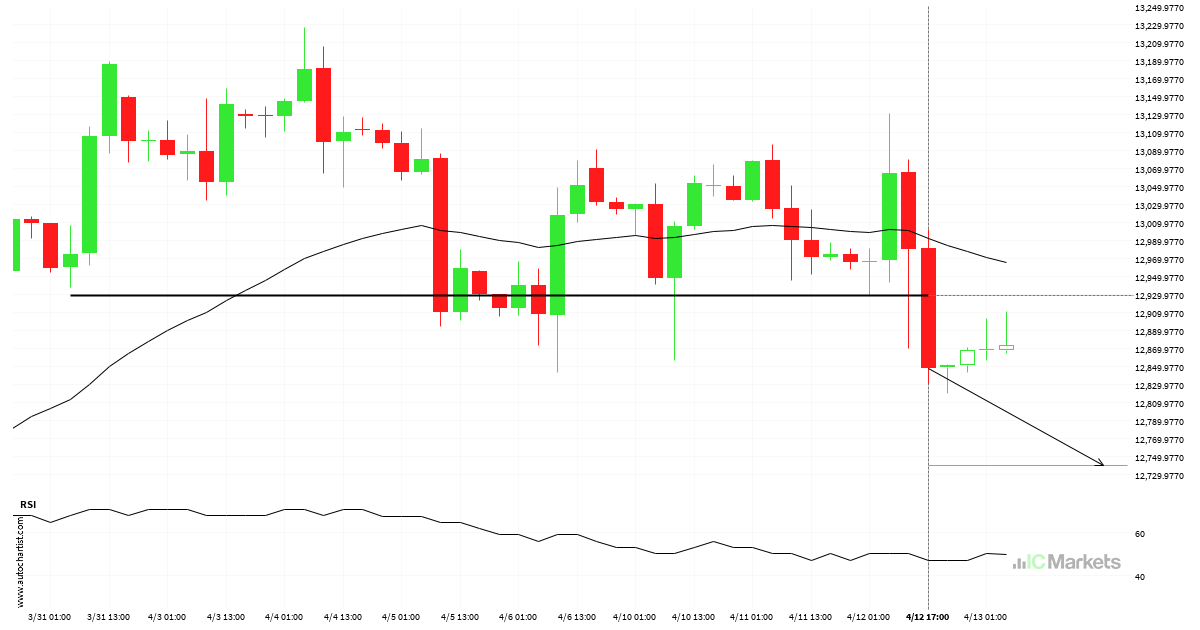
US Tech 100 Index broke through important 12928.5996 price line
US Tech 100 Index has broken through a support line. It has touched this line numerous times in the last 13 days. This breakout shows a potential move to 12740.1602 within the next 2 days. Because we have seen it retrace from this level in the past, one should wait for confirmation of the breakout.